Fighting the weather
Dear donors, since the middle of December, we have seen a significant decrease in the number of confirmed COVID-19 cases in Germany until the end of February. However, until now the Fever Monitor has continued to deviate from the case counts starting around the beginning of the new year. In this post, we will try to explain why we think this happened and introduce to you our updated algorithm.
What happened?
To recap: The Datenspende fever detection algorithm uses resting heart rate and daily step count data from fitness-tracking devices to identify patterns that are characteristic of fever symptoms. We know that increased resting heart rate in addition to decreased physical activity can be indicative of fever, so our algorithm is designed to establish baseline levels of these metrics for every individual and detect deviations from them. When a person’s resting heart rate is significantly elevated at the same time that their daily step count is significantly decreased relative to a threshold defined by how much their measurements tend to vary, a detection is triggered. The fever monitor represents the overall rate of detections across all users over time.
Because fever is one of the core symptoms of COVID-19, the official case counts have been the primary point of reference for our fever detection curves. However, the goal of the data-donation project algorithm is to provide an estimate of the current fever incidence in the population, not to replicate the COVID-19 case counts. Fever can be caused by other illnesses, such as the flu and respiratory infections. However, the strong, observed deviation can not be explained by other sources of fever alone.
The influence of weather
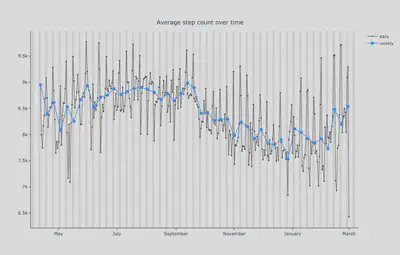
During the summer of 2020, a sudden heatwave caused an initial decrease in heart rate followed by a large spike, while activity levels remained rather stable. This challenged the algorithm because the baseline period was defined as a few weeks beforehand. After the drop in heart rate, suddenly all measurements were way above their baseline. Now, it seems the other way around. After a sudden drop in heart rate and activity levels following the start of the lockdown, step counts have been gradually increasing since the beginning of the year, while the resting heart rate has been relatively unchanged. Take a look at the averages over time:
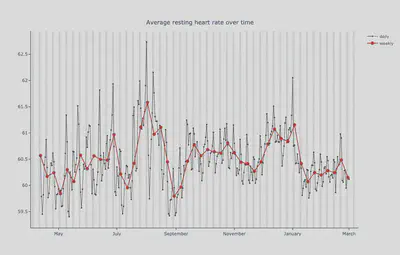
To fix our summer anomaly, we implemented both a normalization to combat abnormal weather effects as well as a longer baseline period for the heart rate. Why the longer baseline period? With the short baseline, brief deviations due to external factors significantly affect this baseline, which, overall, is relatively stable, as you can see in the figure above. Then why are we facing this problem now?
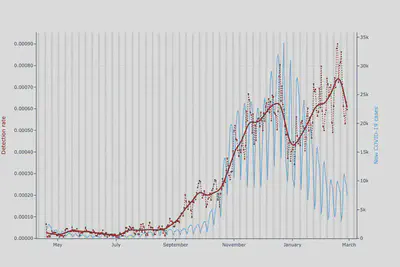
What was the problem?
In the figure showing the step count over time, you can see a long sine wave pattern corresponding to the different seasons. Our longer baseline doesn’t work in this case because, in the winter months, everyone tends to have a lower step count, which, as stated above, is one of the key factors of our algorithm. These changes aren’t due to abnormalities, but a distinct seasonal change spanning multiple months. Thus, if we compare this week’s step count to the one you had 3 months ago, you will likely see a strong deviation. But what if we only looked a few weeks back? This would give a more accurate idea of one’s current activity levels and be able to better detect quick deviations from it.
Better tracking of covid-19 case numbers
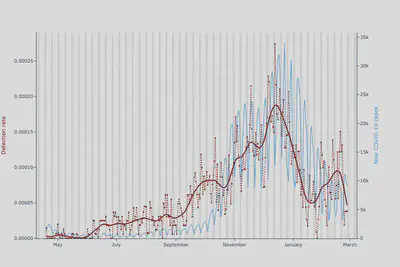
So we changed exactly that. We shortened the length of time for computing the baseline for step count while keeping the long baseline for heart rate. We also put a stronger weight on heart rate, as it is our primary measure and our detections should reflect this. As a result, the fever detection algorithm no longer is affected by external conditions and now aligns much better with the COVID-19 case counts:
We keep improving
The data-donation project is the first of its kind, so it has a strong experimental component and requires occasional improvements of underlying algorithms. In the weeks to come, we expect that additional modifications of the algorithm will become necessary as we refine our methods more and more. Some of you have noticed we removed the individual curves for the federal states. We took this step because we wanted to focus on correcting the trend for the nationwide curve first. We still have the plan to provide regional curves in the future again, but we probably have to aggregate some of the lower population states. If under a certain limit of donors per region, the detection rate turns out to be skewed and does not provide the necessary level of information we intend to share.