Activity
Dear Donors,
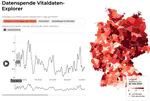
About a year ago, we were able to take stock of the first year of Datenspende. Today, around 470 million donated data points on heart rate, step count and sleep provide us with a unique insight into the development of vital signs under pandemic conditions.
Dear donors, since the middle of December, we have seen a significant decrease in the number of confirmed COVID-19 cases in Germany until the end of February. However, until now the Fever Monitor has continued to deviate from the case counts starting around the beginning of the new year. In this post, we will try to explain why we think this happened and introduce to you our updated algorithm.
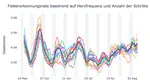
The Corona Data Donation Project is designed to detect fever symptoms in the time-series of the donors’ daily resting heart rate and daily step count signals. See blog post “How does it work?” for the mechanics of how the whole thing works and the basic idea behind it, or check out some of the preliminary results we obtained in the past.
What is the fever monitor?
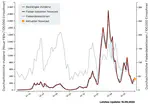
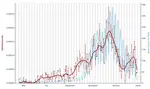
As of today, the Corona Data Donation Project features the Fever Monitor (see menu ‘Tools’ in the top navigation bar).
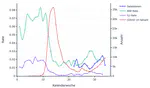
The monitor depicts the time course of the fever detections that we obtain from the raw resting heart rate and step count data the donors provide. Similar results were already discussed in the posts Feverish and Fever curves by federal state.