Average resting pulse increases with number of reported symptoms
As we already know from past analyses, the average resting heart rate of an individual deviates from baseline levels following a COVID-19 infection. Often the resting heart rate takes several months to return to its baseline. In this blog post, we further investigate how this systematic change in heart rate relates to the number of COVID-19 symptoms experienced.
The Resting Heart Rate’s Role in Cardiovascular Wellness
Your resting heart rate (RHR) measures heart beats per minute when the body is relaxed and inactive. It is an important indicator of not only cardiovascular, but overall health, reflecting both long-term and acute biological stress, as well as lifestyle and fitness. For healthy adults over the age of 18, RHR should range between 60 and 100 beats per minute, depending on factors such as physiological condition. However, a resting heart rate lower than 60 is not necessarily a cause for concern – it can also indicate good physical fitness. People who are physically active have stronger heart muscles that are able to pump more blood with each contraction, meaning the heart beats less frequently and more efficiently, which is reflected in a lower RHR.
When your RHR chronically exceeds normal levels, it may be a sign that your body cannot handle physical stress as well as it should. This can be attributed to various lifestyle behaviors, such as insufficient or inconsistent exercise, high levels of daily stress, lack of sleep or poor sleep quality, smoking, drinking, or unhealthy diet.
These behaviors can reflect a gradual increase in RHR. However, if your RHR suddenly increases far beyond its baseline, the root cause is usually found in acute health conditions. Among the main reasons: Infectious diseases.
How infectious diseases put strain on the heart
When a pathogen (e.g., a virus) attacks the front lines of our innate or adapted immune defense, the body undergoes severe stress. Viruses hijack the host’s cellular machinery and use it to replicate and spread inside the organism, triggering a resource-hungry inflammatory response that increases the heart’s workload. As SARS-CoV-2 is able to bind to heart muscle cells, cardiac injury can occur on a direct pathway too, for example as a result of inflamed heart muscular tissue. To defend against these processes, special messengers of the immune system called cytokines cause the body temperature to rise - an effective way to weaken pathogens: Higher temperatures can efficiently slow down their ability to multiply while triggering heat-sensitive cellular mechanisms that boost the immune response.
However, increased temperatures can also be dangerous for the body, especially in the very old and the very young. To prevent severe damage, thermoregulation mechanisms are capable of cooling down the body again - for example by increasing the amount and speed of blood flowing to and within the skin, allowing more heat to be lost over the skins surface. For this whole process to work, more blood has to flow through the skin again causing more strain on the heart.
Now, suppose the body also has less water available, for example, due to vomiting or diarrhea. As a result the blood thickens, making it more difficult to transport. At the same time, acute respiratory infections reduce the amount of oxygen being taken in, causing low levels of oxygen in the blood and, subsequently, to the vital organs which can in some cases be life-threatening.
In short, the more symptoms that occur simultaneously, the greater the increased workload, and the greater the overall burden on the heart. That’s where our data comes into play.
How we can measure this increased strain
Through weekly questionnaires, users of the data donation project reported an array of symptoms associated with a SARS-CoV-2 infection as well as positive and negative PCR test results. Along with wearable-derived data, we investigated how the RHR changes that occur with COVID-19 infection differ with the number of symptoms reported, using the number of symptoms as a proxy indicator for the intensity of the disease.
In this analysis, we averaged individuals’ daily RHR values for 1.5 months before the active infection period and compared this baseline to the highest RHR peak recorded within a detection window of 4 days before and 10 days after the reported test result. This peak deviation is then compared to the symptom count.
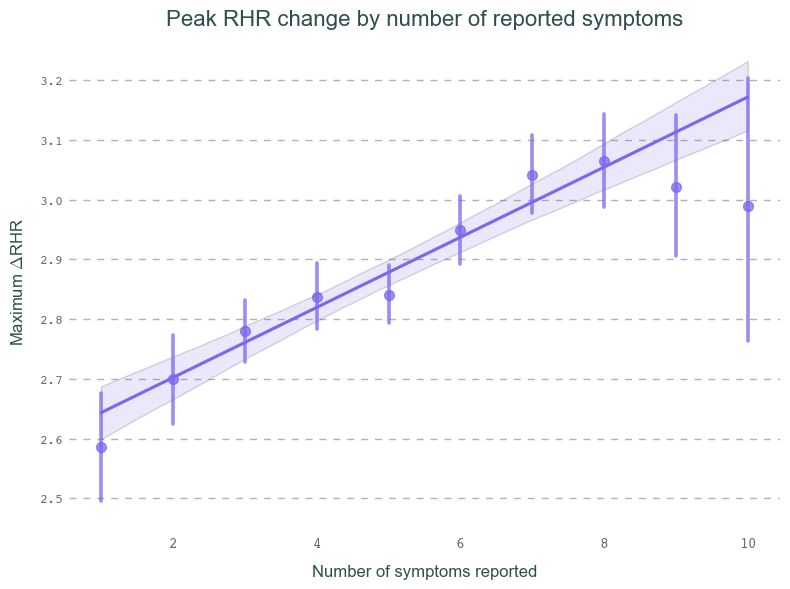
Below, you can see how the peak change in RHR (relative to an individual’s baseline) increases monotonically with an increasing number of symptoms reported during the week of a positive PCR test. For now, we will only focus on people who have reported at least one symptom (so-called symptomatic cases). We will further investigate the resting pulse behavior in asymptomatic records separately in the future.
As people have widely variable resting heart rates, we can not compare the raw RHR values between users. Instead, we use the Z-Score to compare the observed changes in RHR to the person’s normal variations in everyday life. These scores can then be compared between users. In short, a Z-score of 2 denotes the observed value deviates twice as much from the mean as a typical variation normally does. Read how it works here.
Explainer: How do Z-Scores work?
Example: We observe Alex’s heart using a smartwatch. Alex’s heart beats an average of 60 times per minute at rest. Sometimes, it beats a little less, sometimes a little more. Using statistical methods, we can determine how much Alex’s heartbeat deviates on average from the mean value of 60. This is called the standard deviation (SD). In Alex’s case, for example, this could be 1.5 beats per minute. This means: In many cases, Helge’s heart beats between 58.5 and 61.5 times per minute.
A z-score tells you how many of these standard deviations the resting pulse is above or below the average resting heart rate. For instance, in Alex’s case, a resting heart rate of 61.5 bpm would correspond to a Z-score of 1, while 63 bpm would correspond to a Z-score of 2, and so on. Using this measure, we can compare different individuals in a standardized way.
Overall, we find that the RHR in our data continues to increase with each additional symptom reported. For high symptom counts, this correlation starts to flatten out and even dips slightly with 10+ symptoms. This is likely due to the large measurement errors in these categories stemming from significantly fewer users exhibiting so many symptoms.
Our takeaways
The link between symptom count and resting heart rate is a simple but interesting observation that shows us how individually different COVID-19 experiences translate into one’s resting heart rate. What is particularly interesting is that we can already observe this regardless of what specific symptoms were experienced. In the future, we will investigate the role of specific symptoms that have been shown to be early indicators for Long Covid, such as fatigue, headache, shortness of breath, a hoarse voice, and myalgia. We will report back again as soon as we have new results.