Changes in vital data after a COVID-19 infection
Note: Updated on April 11, 2022. See end of this text for details.
Datenspende 2.0 is finally here. Since mid-October you can answer short questionnaires in the app to help us to substantially improve our understanding of the donated vital data in relation to COVID-19. More than 12,000 people have already taken part and entrusted us with this information. For this we would like to express a heartfelt thank you right away.
For instance, in the ‘Tests, Symptoms & Life Situation’ questionnaire, we ask donors about the approximate time and result of their first PCR test. A total of 521 donors reported having a positive test in the past, 5353 donors submitted a negative result.
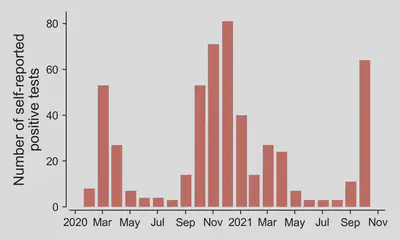
If we look at how often self-reported positive results occurred over time, you can see that this distribution fits very well with the course of the pandemic. We see the first wave in March 2020, the second and third wave in winter 2020/2021 and the fourth wave starting now. Conversely, we observe few positive test results in the summer months.
Prolonged changes in vital signs for COVID-19 positive individuals
If we look at the physiological and activity data before and after a PCR test, we obtain interesting insights into the possible effects of COVID-19 infections. In particular, we calculate the mean change in resting heart rate, step count and sleep duration relative to the baseline period before the test, for both positively and negatively tested donors.
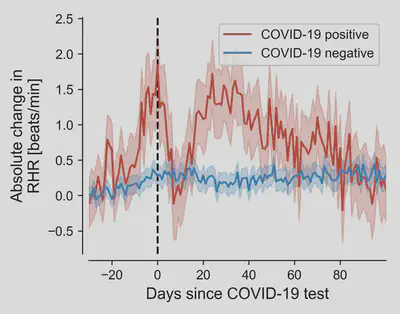
Let’s first look at the resting heart rate. For donors with a confirmed COVID-19 infection, this value increases by an average of 2 beats per minute prior to getting tested. This is followed by a brief normalization period, which has been observed in a previous study, before spiking again and then slowly returning to baseline levels over an extended period of two to three months. In contrast, donors who tested negative show no significant changes over time. The shaded regions represent the so-called confidence intervals that indicate the uncertainty of the mean.
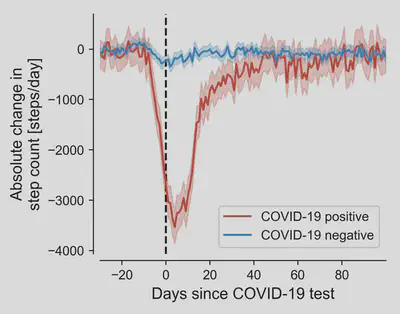
When we look at activity patterns (measured by daily step counts), the influence of COVID-19 is even more pronounced. In the days preceding a positive test result, step counts begin to drop sharply, reducing activity by around 3500 steps per day on average. That’s equivalent to a decline of more than 50% of usual activity! This change lasts for up to a month.
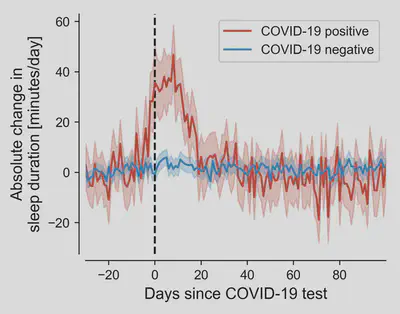
Sleep duration is also affected by COVID-19. Around the time of diagnosis, our COVID-19 positive donors sleep an average of around 40 minutes more, which also takes about three weeks to return to normal.
For all three variables, similar findings have been reported in a comparable study of donated vital data in the United States. This shows that our results are by no means an exception, but are instead consistent with the current state of research.
Improving the fever algorithm
The donated data suggests that COVID-19 can produce prolonged changes in physiological and behavioral signals, particularly in the case of resting heart rate. Next, we will investigate this phenomenon in more detail and use these new findings to improve and validate our fever detection algorithm. In doing so, we will also take into account effects such as sociodemographics and life circumstances.
In one of our first blogposts we already discussed that the demographics of our donors are not fully representative of Germany’s general population and particularly senior citizens, one of the major risk groups for COVID-19, may be underrepresented in the data donation project. Thus, our observed effects may be even more pronounced than what we currently obtain from the donated vitaldata. Additional demographic information that we collect in the second questionnaire of the study ‘Tests, Symptoms & Living Situation’ should therefore help us to extrapolate the effects observed in the vital data more accurately to the whole population in the future . We would like to thank all donors for their continued support in our efforts to better understand COVID-19 through providing us with wearables data as well as entrusting us with vital personal information obtained via the questionnaires. We will continue to keep you informed of further progress here and report new insights made possible by the surveyological data as they become available.
Correction
In an earlier version of the blog post we discussed a maximum change in resting heart rate of up to 3 beats per minute and a return period of up to three months. Likewise, a prolonged sleep duration of 60 minutes was reported. After writing this arcticle, we have improved our calculation to specifically account for seasonal influences, such as altered resting heart rate in winter, and increased activity as well as reduced sleep in summer. To make the results comparable to those in our later blogpost on breakthroughs infections , we adjusted the figures in this blogpost on April 11, 2022 by using our improved algorithm. More detailed information on these calculations can also be found in one of our pre-prints. Furthermore, it should be noted that the graphs presented here only take into account data up until October 2021 so that more recent data may cause the shown curves to become different again.