Reports


Dear Donors,
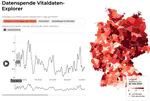
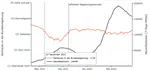
About a year ago, we were able to take stock of the first year of Datenspende. Today, around 470 million donated data points on heart rate, step count and sleep provide us with a unique insight into the development of vital signs under pandemic conditions.
Introduction
In previous blogposts, we have already discussed the sociodemographics and spatial distribution of donors.
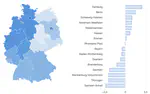
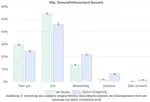
In this blogpost, we will again look at the sociodemographic composition and spatial distribution of donors. For the analysis, we will look at two selection levels each and compare them with the actual population composition (Census update, as of 12/31/2019). To do this, we look at sociodemographic and spatial distribution using three variables: spatial distribution at the state level (classified using the first three digits of the given zip code), gender, and age (recorded in categories of 10). In the first group, the data of the self-report at new registration of all data donors are analyzed, in the second group the data of the sub-study “tests, symptoms and living situation”. We would like to investigate two questions: