Fever Monitor

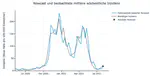
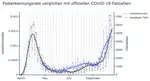
Dear donors, since the middle of December, we have seen a significant decrease in the number of confirmed COVID-19 cases in Germany until the end of February. However, until now the Fever Monitor has continued to deviate from the case counts starting around the beginning of the new year. In this post, we will try to explain why we think this happened and introduce to you our updated algorithm.
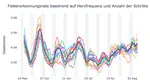
During the past few weeks we have been updating our Fever Monitor on a daily basis, based on the heart rate and activity data measured by the wearable devices and smart watches of more than 520.000 donors.
The Corona Data Donation Project is designed to detect fever symptoms in the time-series of the donors’ daily resting heart rate and daily step count signals. See blog post “How does it work?” for the mechanics of how the whole thing works and the basic idea behind it, or check out some of the preliminary results we obtained in the past.
What is the fever monitor?
As of today, the Corona Data Donation Project features the Fever Monitor (see menu ‘Tools’ in the top navigation bar).
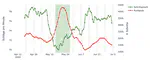
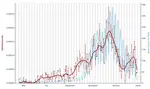
The monitor depicts the time course of the fever detections that we obtain from the raw resting heart rate and step count data the donors provide. Similar results were already discussed in the posts Feverish and Fever curves by federal state.
In the last post Feverish we presented the first national “fever curve” based on and computed from the donors’ data. In this post, we not only want to give you an update on the national fever curve, but also want to show the results we obtained for the individual federal states in Germany.
Remember the goal of the Data Donation Project? When we conceived and launched the project about three months ago we thought that we could use the daily donations of resting heart rate and daily step count to detect the onset of fever in donors which in turn would help us quantify changes in the dynamics of the COVID-19 pandemic because fever is a symptom of the infection. Details of the underlying scientific idea were discussed in the blog post How does it work?.